
The Census Bureau released a report last week showing continued improvements in the uninsured rate between 2014 and 2015 following the implementation of the major coverage provisions of the Affordable Care Act (ACA), including the expansion of Medicaid in 25 states and subsidized coverage through the health insurance marketplaces, in January of 2014. The uninsured rate for all Americans fell from 10.4 percent in 2014 to 9.1 percent in 2015, translating into 4 million fewer Americans uninsured. Since 2013, the number of uninsured Americans has fallen by 12.8 million.
More detailed data from the American Community Survey were also released by the Census Bureau on September 15, 2016. These data show that, in general, coverage gains were larger between 2013 and 2014 than between 2014 and 2015, but results varied by state. In particular, Medicaid expansion appears to result in large coverage gains in the first year of its implementation. In addition, Medicaid expansion states continue to outperform non-expansion states in reductions in the uninsured rate for non-elderly adults across key demographic and income groups.
Medicaid Expansion Reduced the Uninsured Rate Quickly
Nationally, 43.8 percent of the decline in the uninsured rate (Note 1) for non-elderly adults aged 18 to 64 since the major ACA coverage provision went into effect occurred between 2014 and 2015, but there was variation across states. In states that had expanded Medicaid in January 2014, a smaller share of the reductions in the uninsured rate occurred between 2014 and 2015 than in states that expanded Medicaid later or have not yet expanded Medicaid (Figure 1). In the five states with late expansions (Michigan, New Hampshire, Indiana, Pennsylvania, and Alaska), 56.6 percent of the overall reduction in those states’ uninsured rates occurred between 2014 and 2015. In Pennsylvania and Alaska, more than 60 percent of the uninsured rate reduction occurred between 2014 and 2015, the highest of all states, although several other states were nearly as high (Figure 2).
However, many states that made significant gains in lowering their uninsured rates for non-elderly adults between 2014 and 2015 were not among the states with the largest uninsured rate reductions overall since 2013. For example, while Kentucky had a fairly small share (30.9 percent) of its overall uninsured rate decline occur between 2014 and 2015 compared to other states, it still has the largest percentage point drop in the uninsured rate for non-elderly adults between 2013 and 2015 at 12.6 percentage points. As of 2015, 20 states had uninsured rates for non-elderly adults below 10 percent, and all but one were Medicaid expansion states (Note 2), whereas only three states had uninsured rates below 10 percent in 2013.
These results imply that the first year of Medicaid expansion often leads to large uninsured rate reductions, and that the rate of reduction in the uninsured rate diminishes over time for Medicaid expansion states. In addition, while some states are beginning to catch up to the states with early success, the states that expanded Medicaid in 2014 still continue to have larger reductions in the uninsured rate between 2013 and 2015 than non-expansion states (an average of 7.8 percentage points or 43.4 percent versus 6.3 percentage points or 26.4 percent) (Table 1).
Figure 1: Share of the Uninsured Rate Reduction for Non-elderly Adults Occurring in 2015, by Medicaid Expansion Status
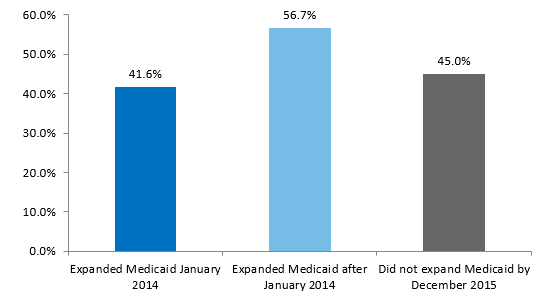
Source: 2013-2015 American Community Survey
Note: States expanding Medicaid in January 2014 were Arizona, Arkansas, California, Colorado, Connecticut, Delaware, District of Columbia, Hawaii, Illinois, Iowa, Kentucky, Maryland, Massachusetts, Minnesota, Nevada, New Jersey, New Mexico, New York, North Dakota, Ohio, Oregon, Rhode Island, Vermont, Washington, and West Virginia.
States expanding Medicaid after January 2014 but before January 2016 were Michigan, New Hampshire, Indiana, Pennsylvania, and Alaska. We note that Montana and Louisiana expanded Medicaid in 2016, but are not included as Medicaid expansion states in this figure.
Figure 2: Share of the Uninsured Rate Reduction between 2013 and 2015 Occurring in 2015, by State
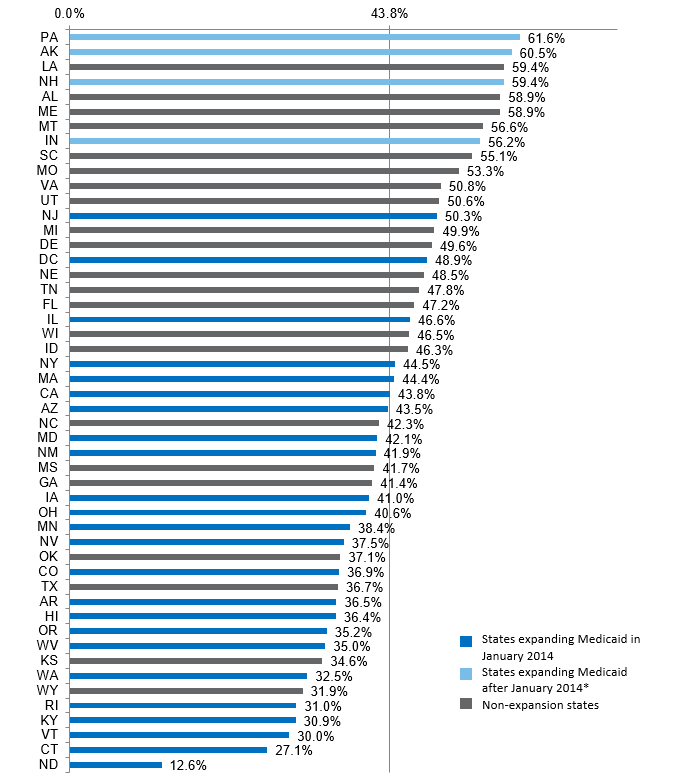
Source: 2013-2015 American Community Survey
Notes: South Dakota had an increase in the uninsured rate between 2014 and 2015, so is not shown above. All reductions in the uninsured rate for non-elderly adults over the 2013-2015 period were significantly different from 0 at the 0.1 level in each state.
*Montana and Louisiana expanded Medicaid eligibility in 2016.
Medicaid expansion states continue to pull ahead
Uninsured rates fell between 2013 and 2015 for all gender, race/ethnicity, and income groups we studied, and reductions in the uninsured rate for these groups were larger in Medicaid expansion states. Non-elderly adults with family incomes at or below 138 percent of the Census poverty threshold living in Medicaid expansion states saw particularly large reductions in their uninsured rate between 2013 and 2015 (44.3 percent, compared to 20.9 percent in non-expansion states) (Note 3). In Medicaid expansion states, the lowest income adults had larger reductions in the uninsured rate than the highest income adults (44.3 percent compared to 39.8 percent), while the opposite was true in non-expansion states (20.9 percent compared to 29.8 percent). In addition, uninsured rates fell by nearly half for women, non-Hispanic whites, and Hispanics in Medicaid expansion states between 2013 and 2015. In contrast, none of the gender, race/ethnicity, or income groups we studied had reductions in their uninsured rates greater than 30 percent in non-expansion states between 2013 and 2015.
Despite these improvements, gaps in coverage by race/ethnicity and income are still large. Non-elderly adults with incomes below 138 percent of Census poverty had an uninsured rate nearly six times higher than that of adults with incomes above 400 percent of Census poverty in 2015 (five times higher in expansion states, six times higher in non-expansion states). Similarly, Hispanics had uninsured rates three times higher than non-Hispanic whites in 2015.
Table 1: Changes in Uninsured Rates for Non-elderly Adults between 2013 and 2015 for Selected Characteristics, by Medicaid Expansion Status
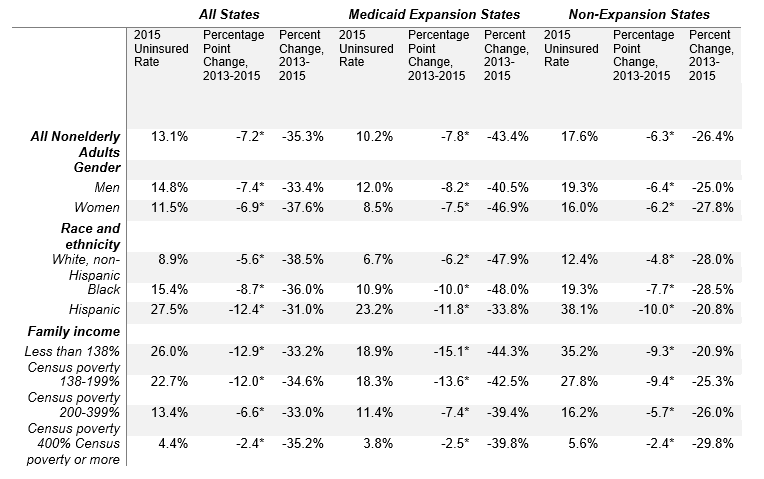
Source: 2013-2015 American Community Survey
*Percentage point change is significantly different from 0 at the 0.1 level.
Data Limitations
The aggregate American Community Survey from the Census Bureau has some important limitations. The income reported here is aggregated at the family level and compared to the Census Poverty threshold, which does not directly match the poverty threshold and income counting rules used for ACA eligibility. In addition, not all races are reported with those also reporting Hispanic ethnicity removed, so there is some double counting between black and Hispanic results. Finally, standard errors used to calculate statistical significance are approximated from the margins of error reported by the Census Bureau.
What’s Next
The latest results are consistent with estimates from the 2015 National Health Interview Survey, which also found decreases in the uninsured rate across all income groups. The Census Bureau will release the 2015 ACS microdata on October 20, 2016. This data will allow more detailed investigation of changes in insurance coverage between 2013 and 2015 at the state and local level, including investigation of differences in uninsured rates by date of Medicaid expansion, outreach and enrollment strategies, and other factors that may influence the speed of coverage gains across states. As states continue to expand Medicaid and attempt to reach the remaining uninsured of all incomes, such research could shed light on how outreach and enrollment practices and other policy differences affect coverage take-up, potentially pointing to policy changes that would help struggling states improve their uninsured rate.
Note 1
We calculate this percentage by dividing the percentage point decline in the uninsured rate from 2014 to 2015 by the percentage point decline in the uninsured rate from 2013 to 2015.
Note 2
Wisconsin was the only non-expansion state in this group, potentially reflecting more generous Medicaid eligibility for childless adults and parents than in other non-expansion states.
Note 3
The percent reduction in the uninsured rate between 2013 and 2015 is calculated by dividing the percentage point change from 2013 to 2015 by the 2013 uninsured rate.