
There are few surprises in the government’s recent 11-year projections of national health expenditures (NHE). The 5.8 percent average growth rate is the same as last year’s projection and the annual pattern is also largely the same. Over the 11-year period, gross domestic project (GDP) is projected to average 4.5 percent growth. Thus, the excess growth in NHE is projected at 1.3 percentage points or, more concisely, NHE growth is projected at GDP+1.3.
This has been referred to as “moderate” growth. Compared to our long-run historical experience, it certainly is — since 1980, NHE growth has averaged 7.8 percent or GDP+2.2. Nonetheless, as David Cutler noted in his commentary on Health Affairs Blog, it represents a departure from the historically low post-recession growth rates (under 4 percent and about GDP+0) leading up to expanded coverage under the Affordable Care Act in 2014. David provides hopeful thoughts as to how and why we might “normalize” to these historically low rates rather than transitioning to the moderate (and higher) rates projected by the government.
A Few Observations
Here are items in the projections that stood out to me.
- The projections show 5.5 percent growth in 2015. This is slightly higher than the 5.3 percent growth in 2014 but well above the 3.7 percent average rate for the five years (2009-2013) leading up to 2014 coverage expansion. Thus, the coverage expansion seems to have pushed NHE growth rates up by about 1.5 percentage points in 2014 and 2015. (The introduction of new hepatitis C drugs also occurred in 2014 and contributed to the increase.)
- Coverage is leveling off in 2016, which helps explain the lowering in NHE growth for that year to 4.8 percent. All else being equal, we might expect the rate to move back to close to 4 percent in 2017 and 2018 as coverage fully levels off. (Spending on hepatitis C drugs has recently been declining!)
- However, instead we see the rate moving up to 5.1 percent in 2017 and 6.0 percent in 2018, where it remains (roughly) through the rest of the forecast period.
Why shouldn’t we expect the growth rate to return to the historically low pre-expanded coverage levels (averaging 3.7 percent from 2009 through 2013)? First, economy-wide price inflation is projected at 2.2 percent in the out years while it averaged 1.7 percent during the pre-expanded coverage years of 2009-2013. Econometric models show that health spending responds quickly to such price inflation so this should push health spending growth up by about 0.5 percentage points compared to 2009-13.
Second, the unusually low rate of growth in spending on prescription drugs (1.9 percent) during 2009-13, which was driven primarily by the timing of patent expirations, is very unlikely to be repeated in the out years. Sure enough, the government projects spending on prescription drugs to average 6.8 percent growth during 2018-25. This faster growth in prescription drug spending, which seems like a reasonable projection, pushes the overall NHE growth rate up by about 0.4 percentage points.
Third, the impact of the recession (2008-9) on health spending growth in 2009-13 does not extend to the out years. Econometric models show that recessions reduce the rate of growth in health spending for five years or so after the recession. I have not undertaken a careful study, but I believe the recent recession could have reduced the average growth rate in health spending in 2009-13 by as much as 0.5 percentage points.
Between higher price inflation, the lack of major drug “patent cliffs,” and the lack of a recession, health spending in the out years should exceed that of the 2009-13 period by about 1.4 percentage points, putting the expectation at 5.1 percent.
The government’s projection for 2018-25 is for 6.1 percent NHE growth, so there is a percentage point of increased growth (relative to 2009-13) not explained by price inflation, prescription drugs, and the recession. This is explained by baby boomers aging into higher rates of health spending during this period, as well as some lagged effects of the economic expansion.
This all suggests that the projections are credible. But will they come true? Frankly, I hope not.
Why These Modest Growth Rates are a Serious Problem
As Gene Steuerle passionately argued at our 2016 Center for Sustainable Health Spending symposium, health economists should pay more attention to the share of the growth in real per capita income that goes to health spending. The chart below shows that between 1980 and 2007, health spending absorbed 25 percent of our income growth. Based on the government projections, health spending will account for 42 percent of our income growth between 2007 and 2025 (where income refers to real per capita GDP)!
Exhibit 1
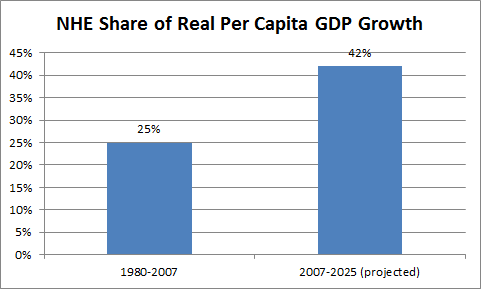
Source: author’s calculations using government data
In 1980, health spending accounted for 8.4 percent of GDP. Little by little, as income grew and we spent 25 percent of this growth on NHE, health’s GDP share increased to 15.6 percent in 2007. Had we continued on this path indefinitely (by my analysis, there was no trend up or down), NHE would have slowly approached 25 percent of GDP, never to exceed it. However, if we shift to the government’s projected path indefinitely, we will slowly trend toward NHE in excess of 40 percent of GDP (reaching 19.9 percent in 2025, and, by my calculations, 26.6 percent by 2050).
Some might argue that this is not a serious problem. If, as we become more affluent, we choose to spend more and more on health care, so what? We can do what we want.
The flaw in this argument comes down to the “we” in these statements. The United States is not one big family deciding how to spend its income. “We” consist of many families, most of whom already cannot afford the full cost of health insurance. Under the Affordable Care Act (ACA), even those at 400 percent of the federal poverty level of income are deemed to require subsidies to afford health insurance, and 63 percent of the population is at or below this income level.
Consider that segment of the population with income above 400 percent of poverty level that is fortunate enough to afford the full cost of their own insurance. As health care costs rise over time, they may be happy to spend more of their income on their own health insurance, but they are also required to spend an increasing share of their income subsidizing health care for others. Some members of this group object (to put it mildly) to this requirement.
We Face Painful Choices
This conflict plays out in our day-to-day politics as we argue over taxes and publicly supported health programs such as Medicare, Medicaid, and the expanded coverage provisions of the ACA. The tradeoffs are illustrated in the Triangle of Painful Choices that is discussed in more detail in this Health Affairs Blog post. Even at NHE growth of GDP+0, we would be faced with the following sorts of quite painful tradeoffs by the time we reach 2035:
- raise taxes by 4 percent (relative to their historic high) and cut spending on defense and other non-health by 35 percent (relative to their historic low);
- raise taxes by 9 percent and cut defense and other non-health by 24 percent;
- raise taxes by 15 percent and cut defense and other non-health by 12 percent;
- raise taxes by 20 percent and keep spending on defense and other non-health at their historic lows.
How to Achieve Slower NHE Growth and Improve our Future Options
There are certainly opportunities to reduce the rate of growth in NHE. David Cutler notes large potential savings in the areas of wasteful spending, cost sharing, payment reform, and administrative costs. I would emphasize the need to keep pushing down on health care prices, which tend to be much higher in the US than elsewhere and are the main reason why our NHE share of GDP is so much larger than other advanced nations.
Another possible outcome has been described by Uwe Reinhart and Tsung-Mei Cheng in a provocative set of slides they prepared for our symposium. They note the difficulty in controlling health care prices in the US and conclude that the focus will be on health care utilization. They present evidence that we are already in the process of structuring a system that will ration health care by income class. (The Health Affairs paper by Dickman et al appears to support this position). This would reduce the rate of growth in health spending, but primarily for those who cannot afford the full cost of health insurance. Thus, it would reduce the amount that higher income individuals would be asked to pay in support of other people’s health care. Reinhardt and Cheng lay out the ethical implications of this restructuring.
The Next Recession is Likely to Spur Action
We have entered the eighth year since the end of the last recession and, in U.S. history, the gap between recessions has never exceeded ten years. Thus, it seems likely that there will be another recession within the next few years. This will focus the nation’s attention on the federal deficit, the debt to GDP ratio, and the urgency of reducing the health spending cost trend. I am not sure what the resulting actions will be, but I believe we will be successful in slowing the cost trend because we must.