
For several decades, there has been a general consensus that the nation would benefit from an increased supply of primary care practitioners, including physicians. Most reform efforts to improve health care, including the Affordable Care Act (ACA), have viewed an increased focus on primary care as essential for improving the delivery system and outcomes of care. According to the Center for Health Workforce Studies (CHWS) demand index, these efforts are beginning to pay off.
Since the late 1990s, the Center for Health Workforce Studies, which is located at the University at Albany, State University of New York, has surveyed residents and fellows in New York State each spring as they complete their training. The survey asks several questions related to post-training plans and experiences finding a job. From these questions, CHWS developed a demand index. Using this demand index, they rank the relative demand for the 25 largest specialties: the specialty with the highest relative demand is ranked first and the specialty with the lowest relative demand is ranked 25th. CHWS has achieved consistency in the metric by using the same basic questions and methodology for the surveys throughout its 17 years of existence.
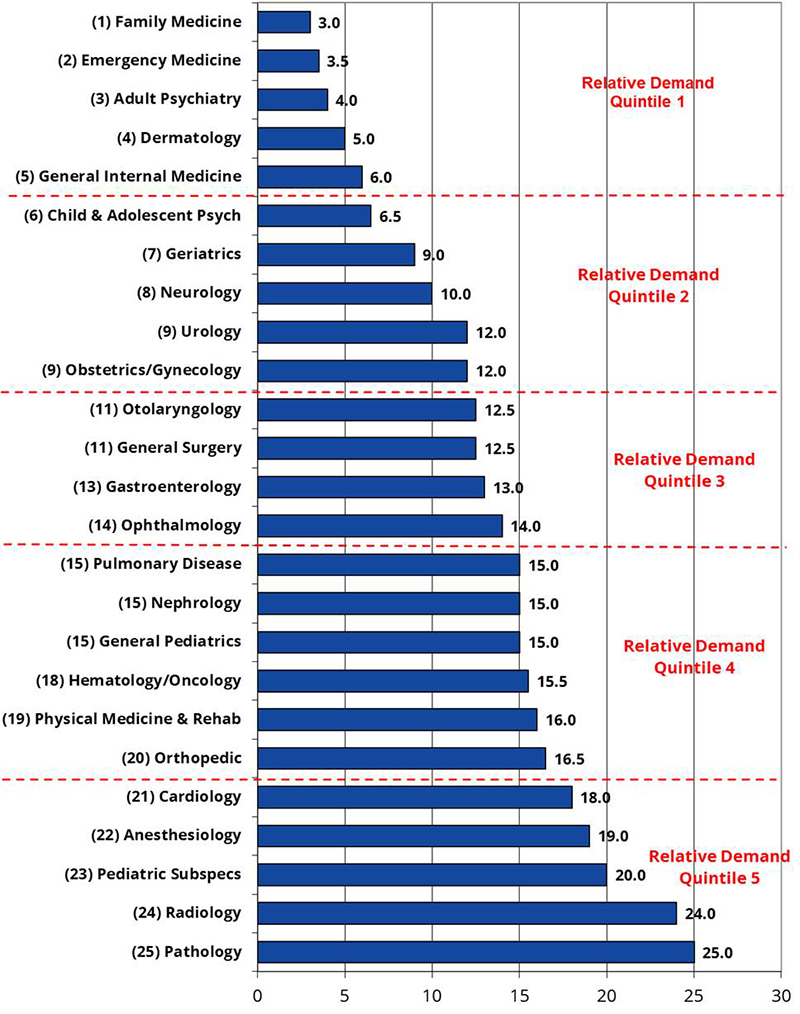
With the excellent collaboration of teaching hospitals, a total of 2,897 of the estimated 5,308 physicians finishing a residency or fellowship training program completed the 2015 Exit Survey (55 percent response rate). In 2015, for the first time since CHWS began collecting this data and producing the demand index, family medicine ranked highest among the 25 ranked specialties (as seen in Exhibit 1 and Exhibit 2). This has been a long time coming. After ranking in the upper teens for many years, family medicine’s relative rank began to improve in 2008, leading to its top rating in 2015.
The Demand Index
To measure demand, each specialty is ranked on each of the following demand indicators:
- Percentage of respondents having difficulty finding a satisfactory practice position;
- Percentage of respondents having to change plans due to limited practice opportunities;
- Mean number of job offers received by respondents;
- Respondents’ perceptions of the regional job market (within 50 miles of their training program);
- Respondents’ perceptions of the national job market; and,
- Trends in median starting income.
Only residents and fellows completing training in New York State who had actively searched for a job are included in the survey, and they may or may not be representative of physicians training in the U.S. While New York State trains about 15 percent of all residents and fellows in the US, the job market they face may be very different than that in other parts of the country. We do know that New York State Graduate Medical Education has an unusually high percent of International Medical Graduates on temporary visas (about 18 percent), but they have been excluded from the demand index.
There is no single, right way to measure demand. While the criteria used here seem reasonable, it is likely that different criteria (e.g., a single indicator) could lead to a different ranking. By creating an index, CHWS has developed a tool that is less likely to be affected by any particular indicator.
Policy Discussion
While indicated in only one instance from one state, the rise of family medicine to the specialty with the greatest demand among New York State trainees is a very positive development. The ranking is somewhat surprising given that primary care advocates have been calling for greater support for several decades with little response. It is worth noting that New York State has not been known to be particularly friendly to family medicine residency training. For many years, few of the state’s academic medical centers even offered family medicine training, making this an even more noteworthy development. For example, New York has 26 (5.2 percent) of the 498 Accreditation Council for Graduate Medical Education accredited family medicine programs in the country compared to the state’s 1,169 (11.6 percent) of 10,068 accredited programs in total.
The exact reason this has happened at this time is not clear. Perhaps it reflects the push by provider organizations and/or insurance groups to promote a more primary care and patient-centered model of care, as well as a push for value-based reimbursement. In any case, medical students and residents should be made aware that the job market is good for primary care practitioners and that there are likely to be many job opportunities for them in the next few years. This conclusion is consistent with other recent reports on rising primary care compensation from recruiting firms. The agreement between these various data sources on increasing demand for family practitioners validates the findings from the New York State survey responses.
Although the CHWS survey presents a snapshot of the current market, it does not tell us about the future. The historical trend line indicates high demand now, but the future demand for family medicine depends on continued policy and financial support. Public policies such as those promoting value-based reimbursement and enhanced reimbursement for primary care services will need to continue to promote primary care practice if we are to assure an adequate supply of well-prepared primary care practitioners as the cornerstone of a more effective and efficient delivery system.
Exhibit 1
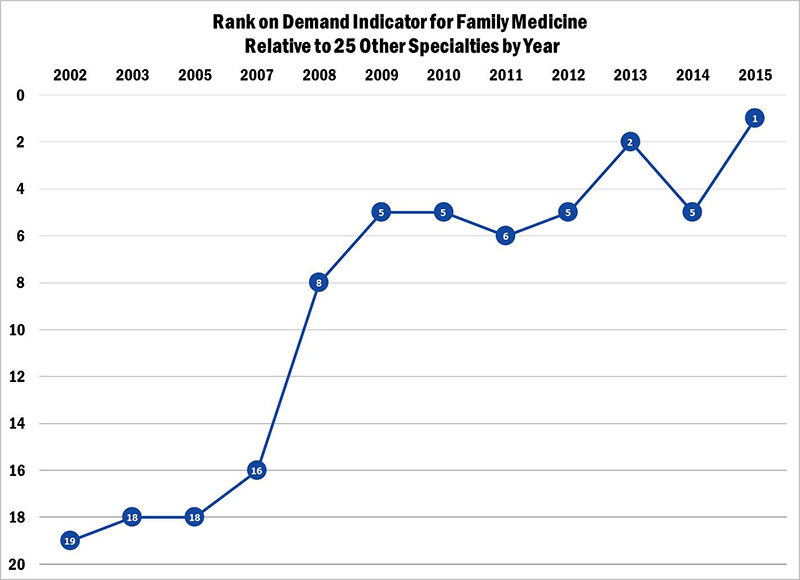
Exhibit 2
Author’s Note
Edward Salsberg was involved in the original development and design of the index while director of CHWS in the late 1990s.